Business Knowledge Editor¤
Introduction¤
The Business Knowledge Editor (BKE) allows the visual exploration and authoring of Knowledge Graphs. Resources are rendered as nodes on a canvas and can be expanded along the relationships that connect them to other resources. Explorations can be saved as named visualizations, shared and re-opened later.
Which resources can be found, how edges are labeled and which graph is explored by default is controlled by the Application view configuration module, see Configuration below.
Usage¤
Start the module by selecting Business knowledge editor in the main navigation.
Starting a visualization¤
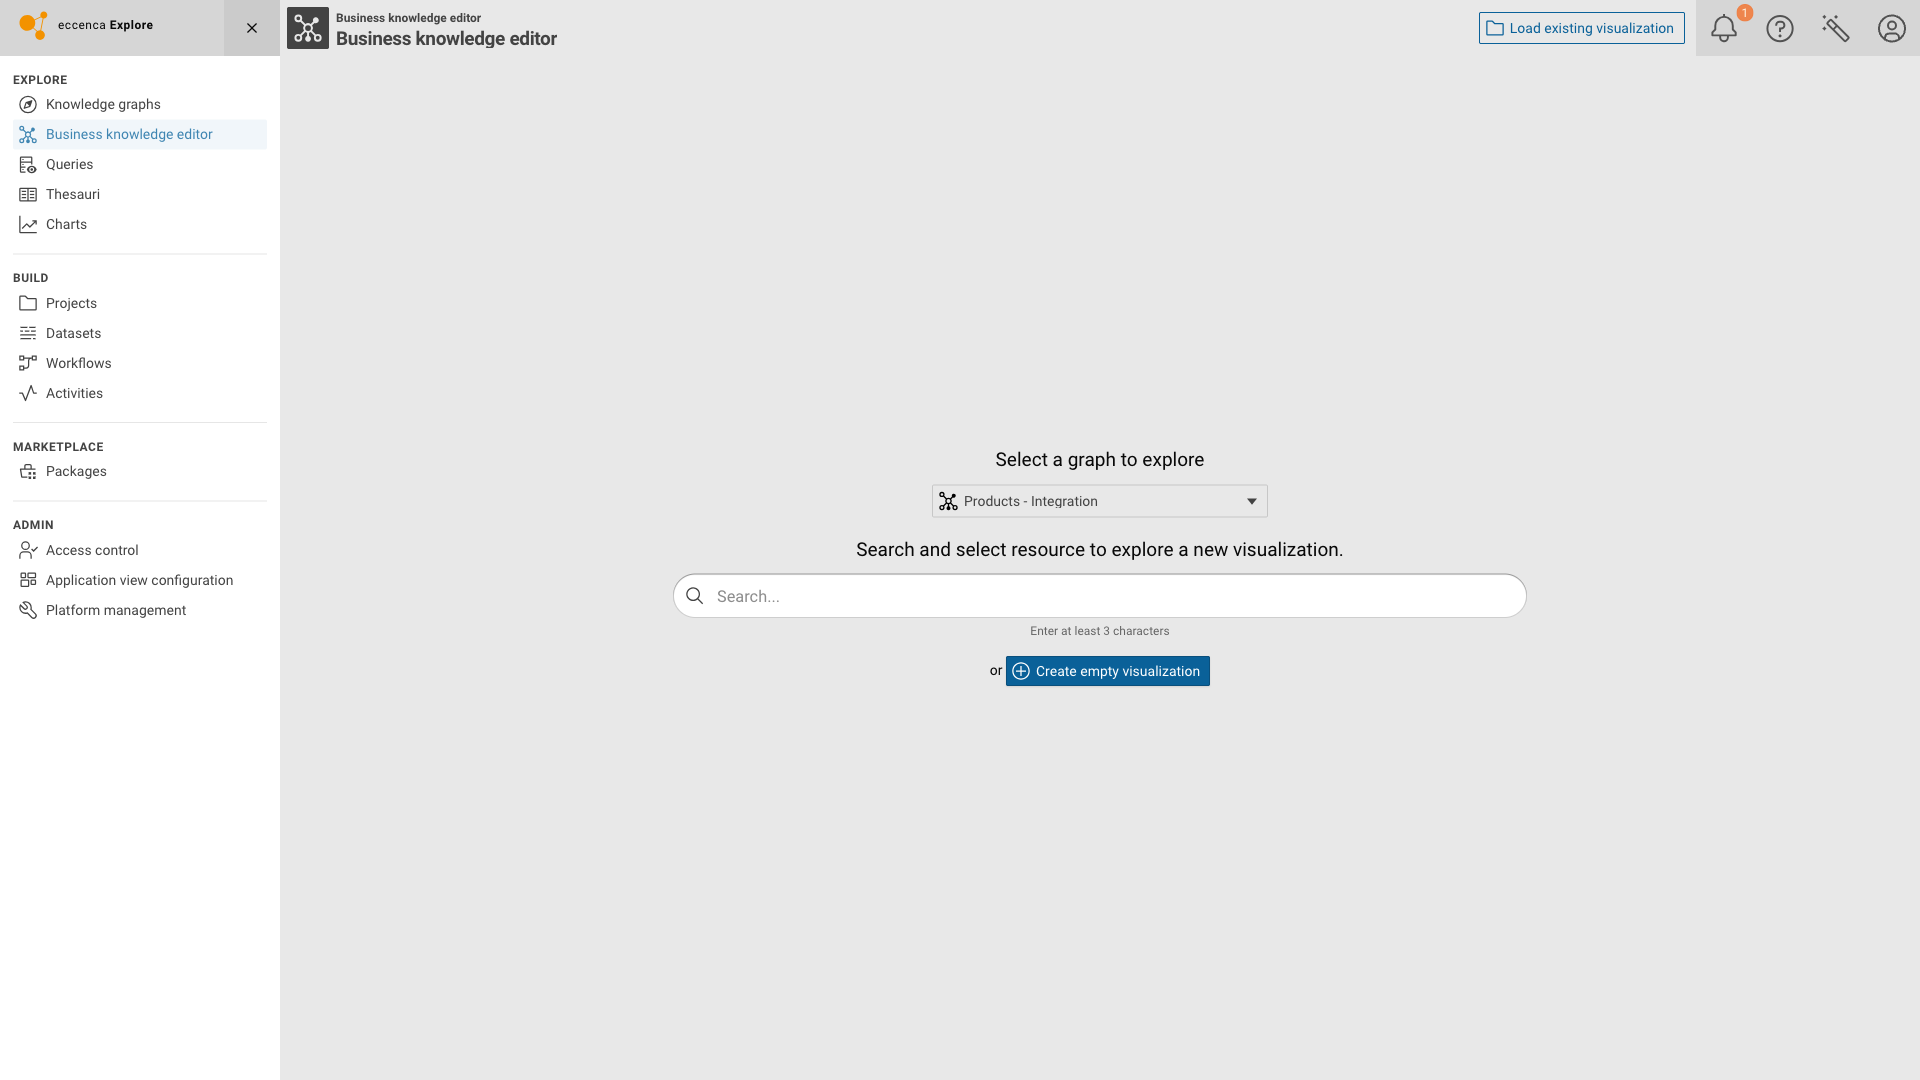
The module welcome screen offers three ways to begin:
- Search and select a resource to start a new visualization from that resource.
- Create empty visualization to start with an empty canvas, e.g. to author an ontology.
- Load existing visualization (upper right) to re-open a saved visualization.
Note
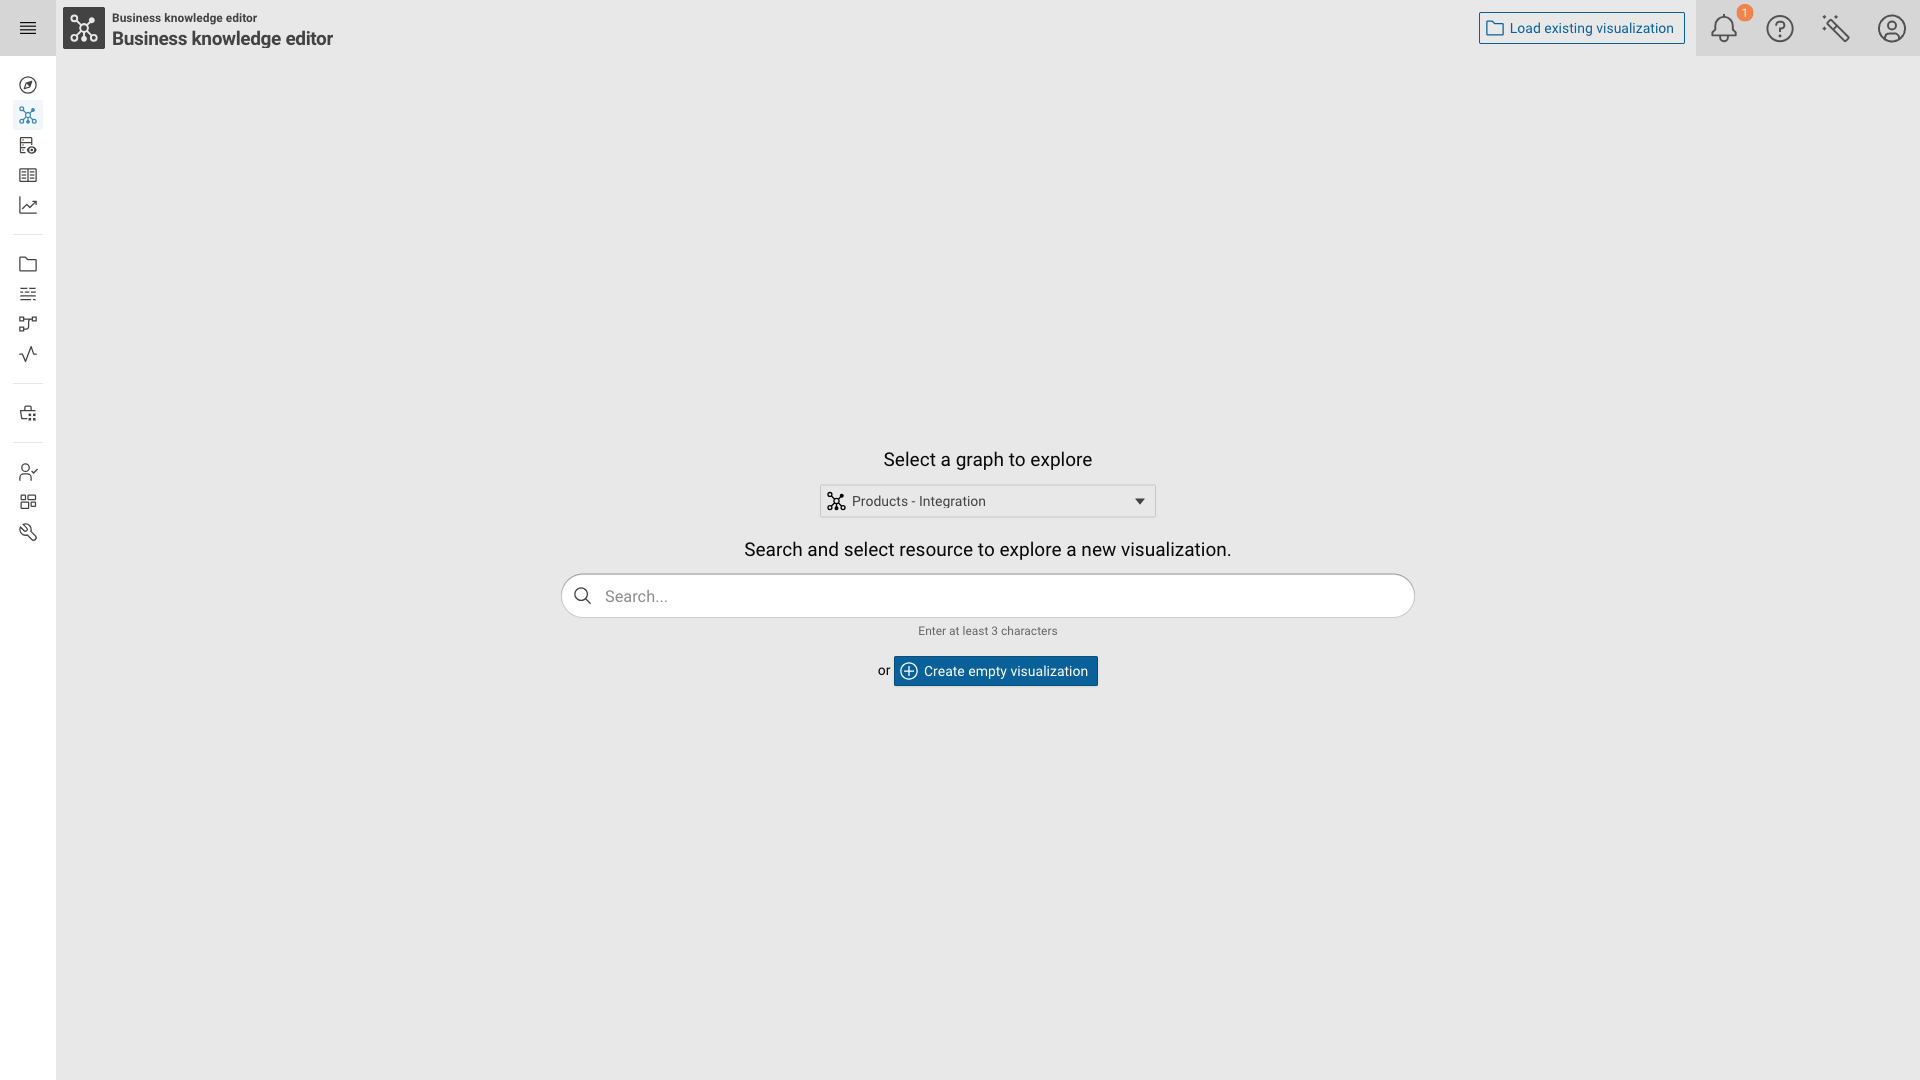
The Select a graph to explore drop-down is only shown if no contextGraph is configured for the module in the
current Application view. If a contextGraph is configured, that graph is used and the drop-down is omitted.
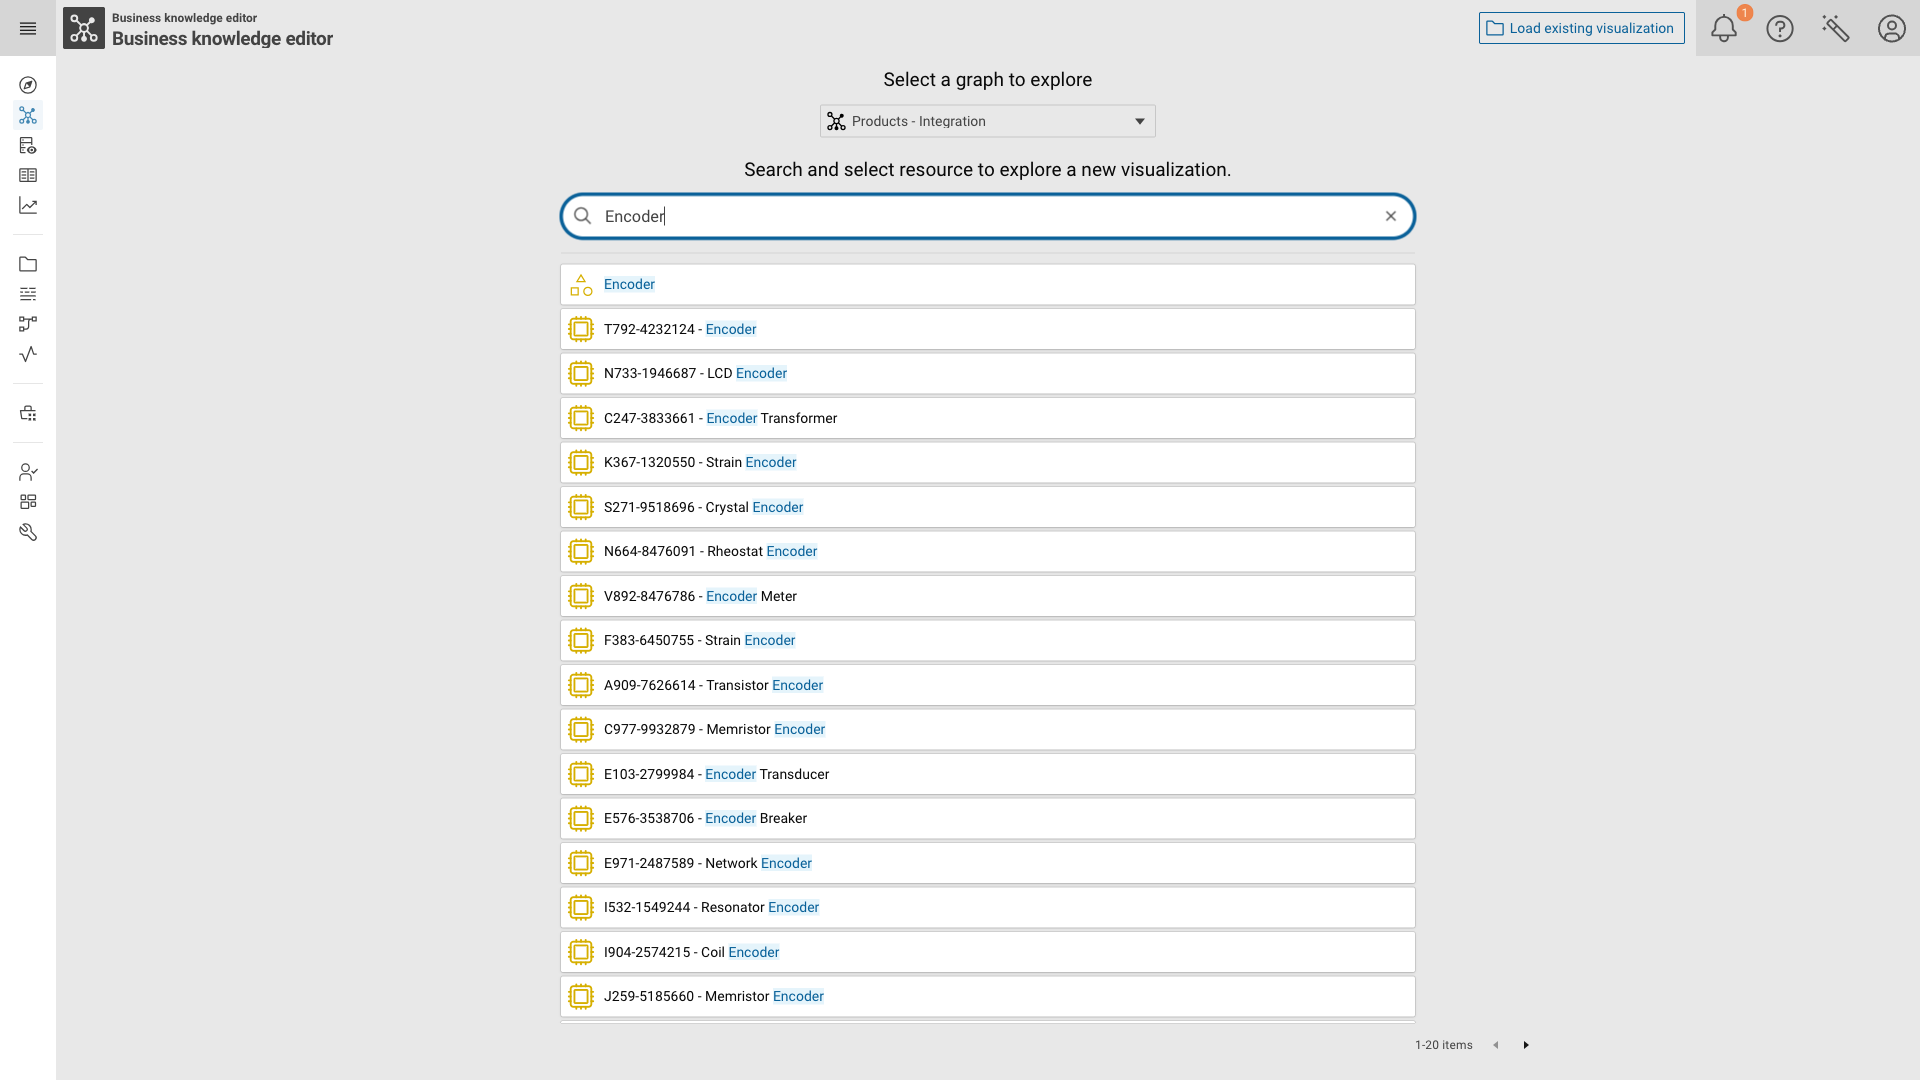
Enter at least three characters to populate the result list, then click a result to open the exploration canvas.
Note
The result list is produced by the searchListQueries configuration of the module.
By default it contains two presets, one for instances and one for classes, which is why the example above returns the class Encoder as well as the hardware instances labeled with it.
See Configuration on how to tailor these presets.
The canvas¤
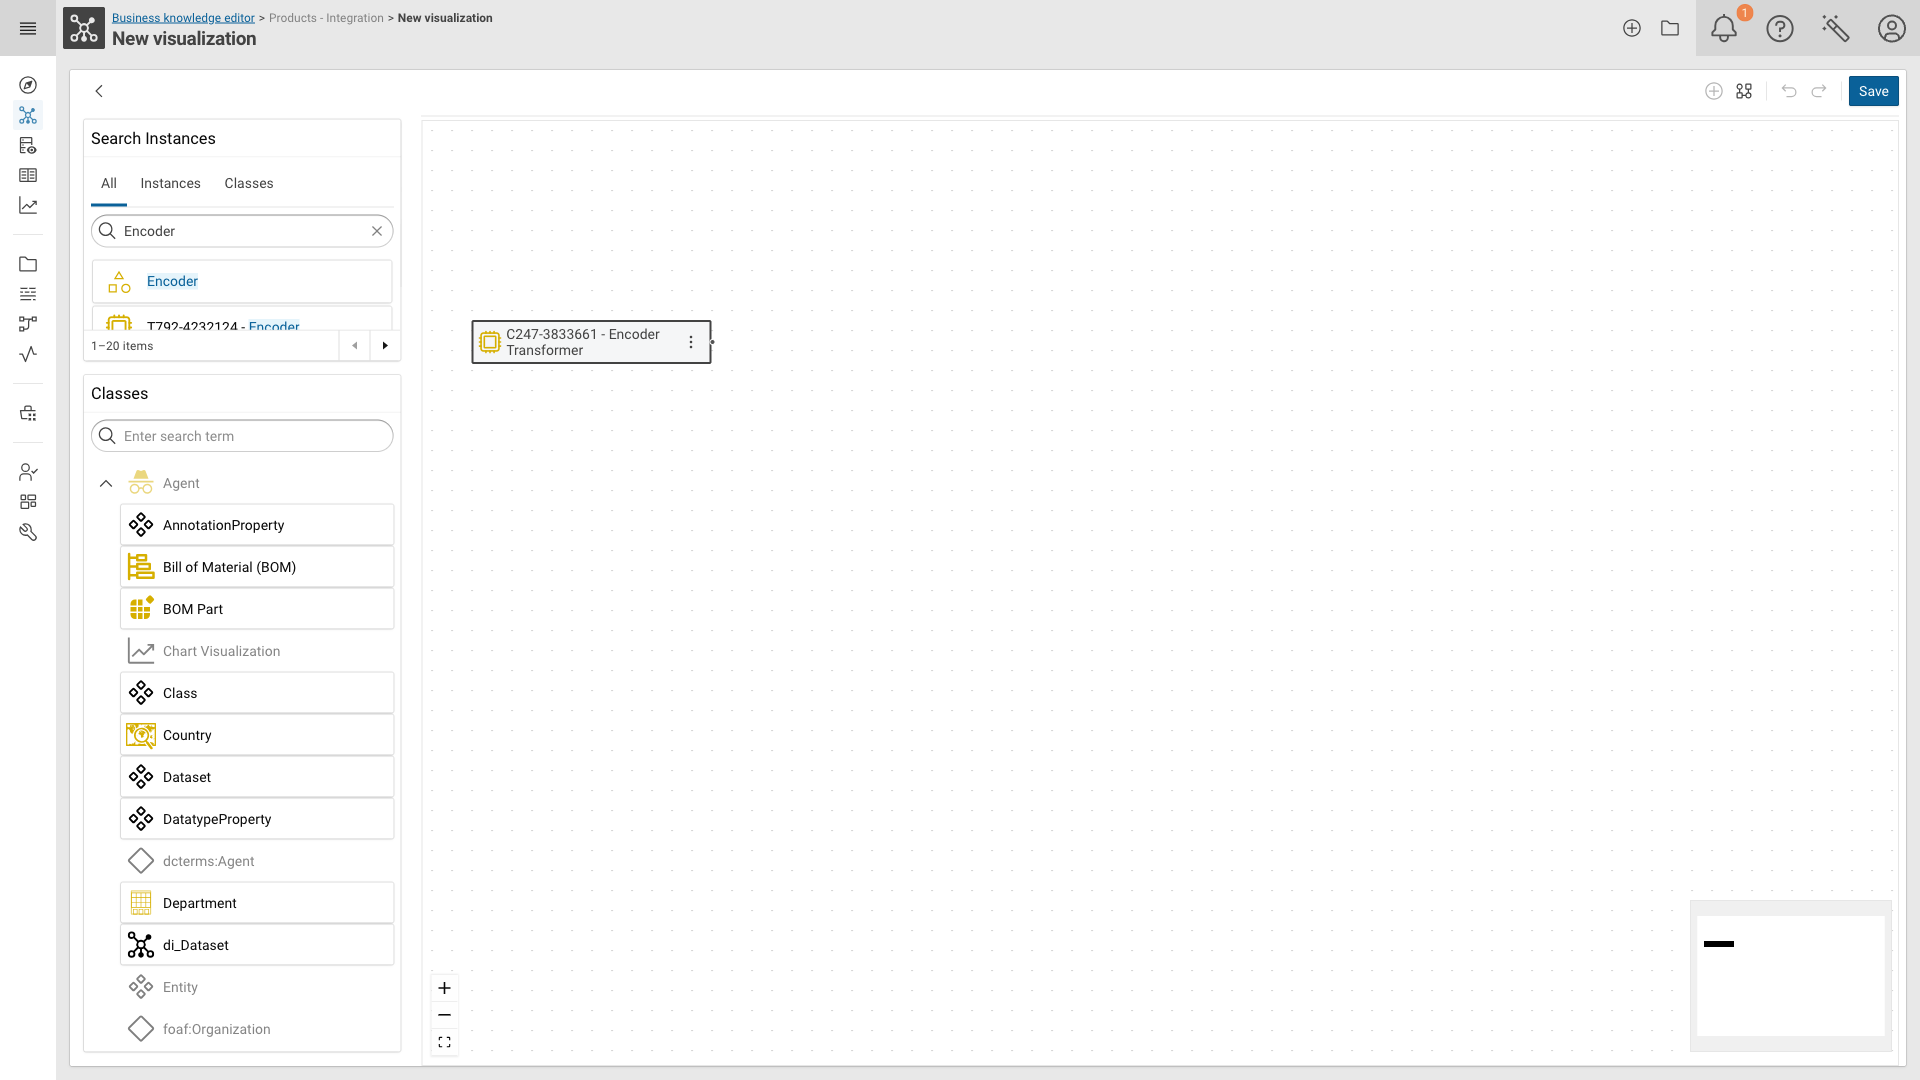
The canvas is framed by:
- Search Instances (upper left) — search for further resources to add to the canvas.
The tabs (
All, plus one per configured search preset) let you restrict the search to a single preset. - Classes (lower left) — the classes of the explored graph. Drag an entry onto the canvas to create a new resource of that class.
- Canvas toolbar (upper right) — Start new visualization from selected nodes, Arrange (auto-layout), Undo, Redo and Save.
- Zoom controls and minimap — zoom in/out, Fit View and an overview of the whole visualization.
Expanding a resource¤
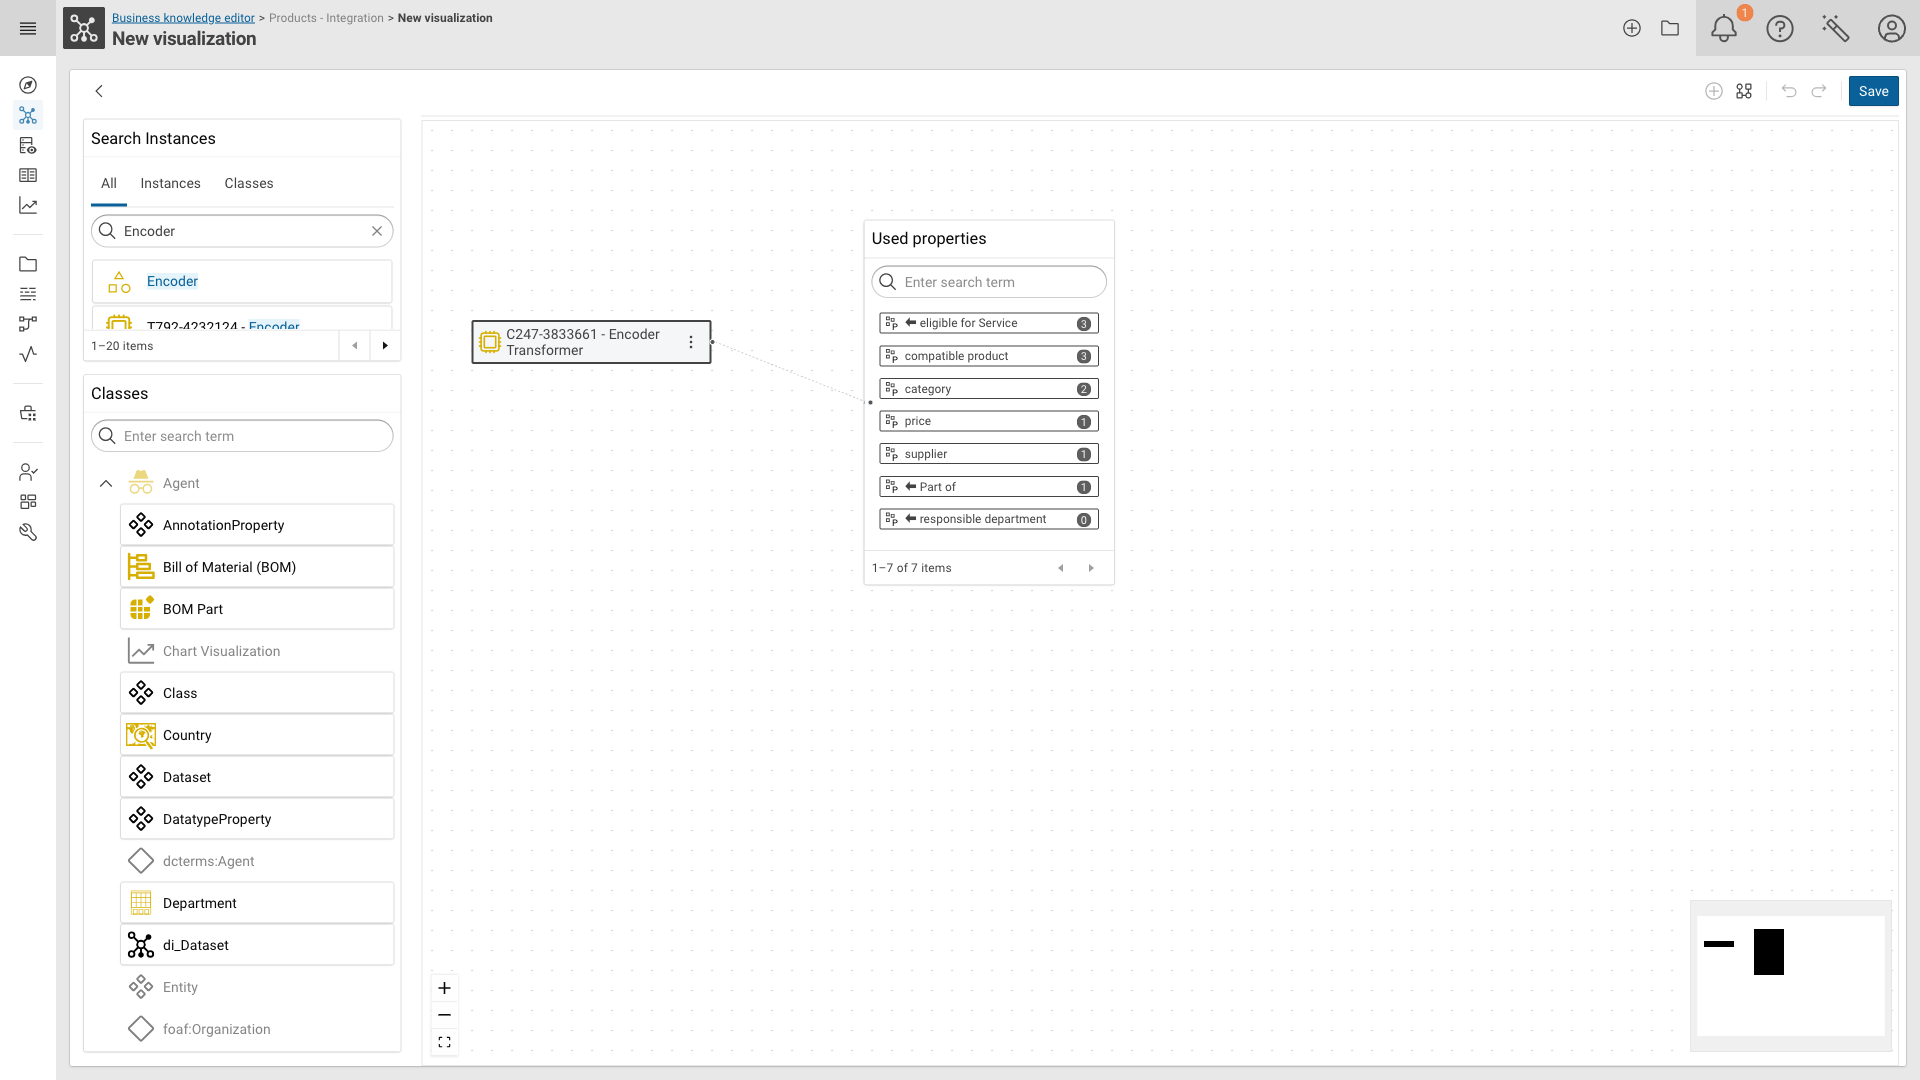
Hover a node and click the connector dot on its right edge to open the Used properties panel. It lists every property used by this resource together with the number of related resources. A in front of the property name marks an incoming (inverse) relation.
Select a property to open the Linked Resources panel with the resources reachable via that property.
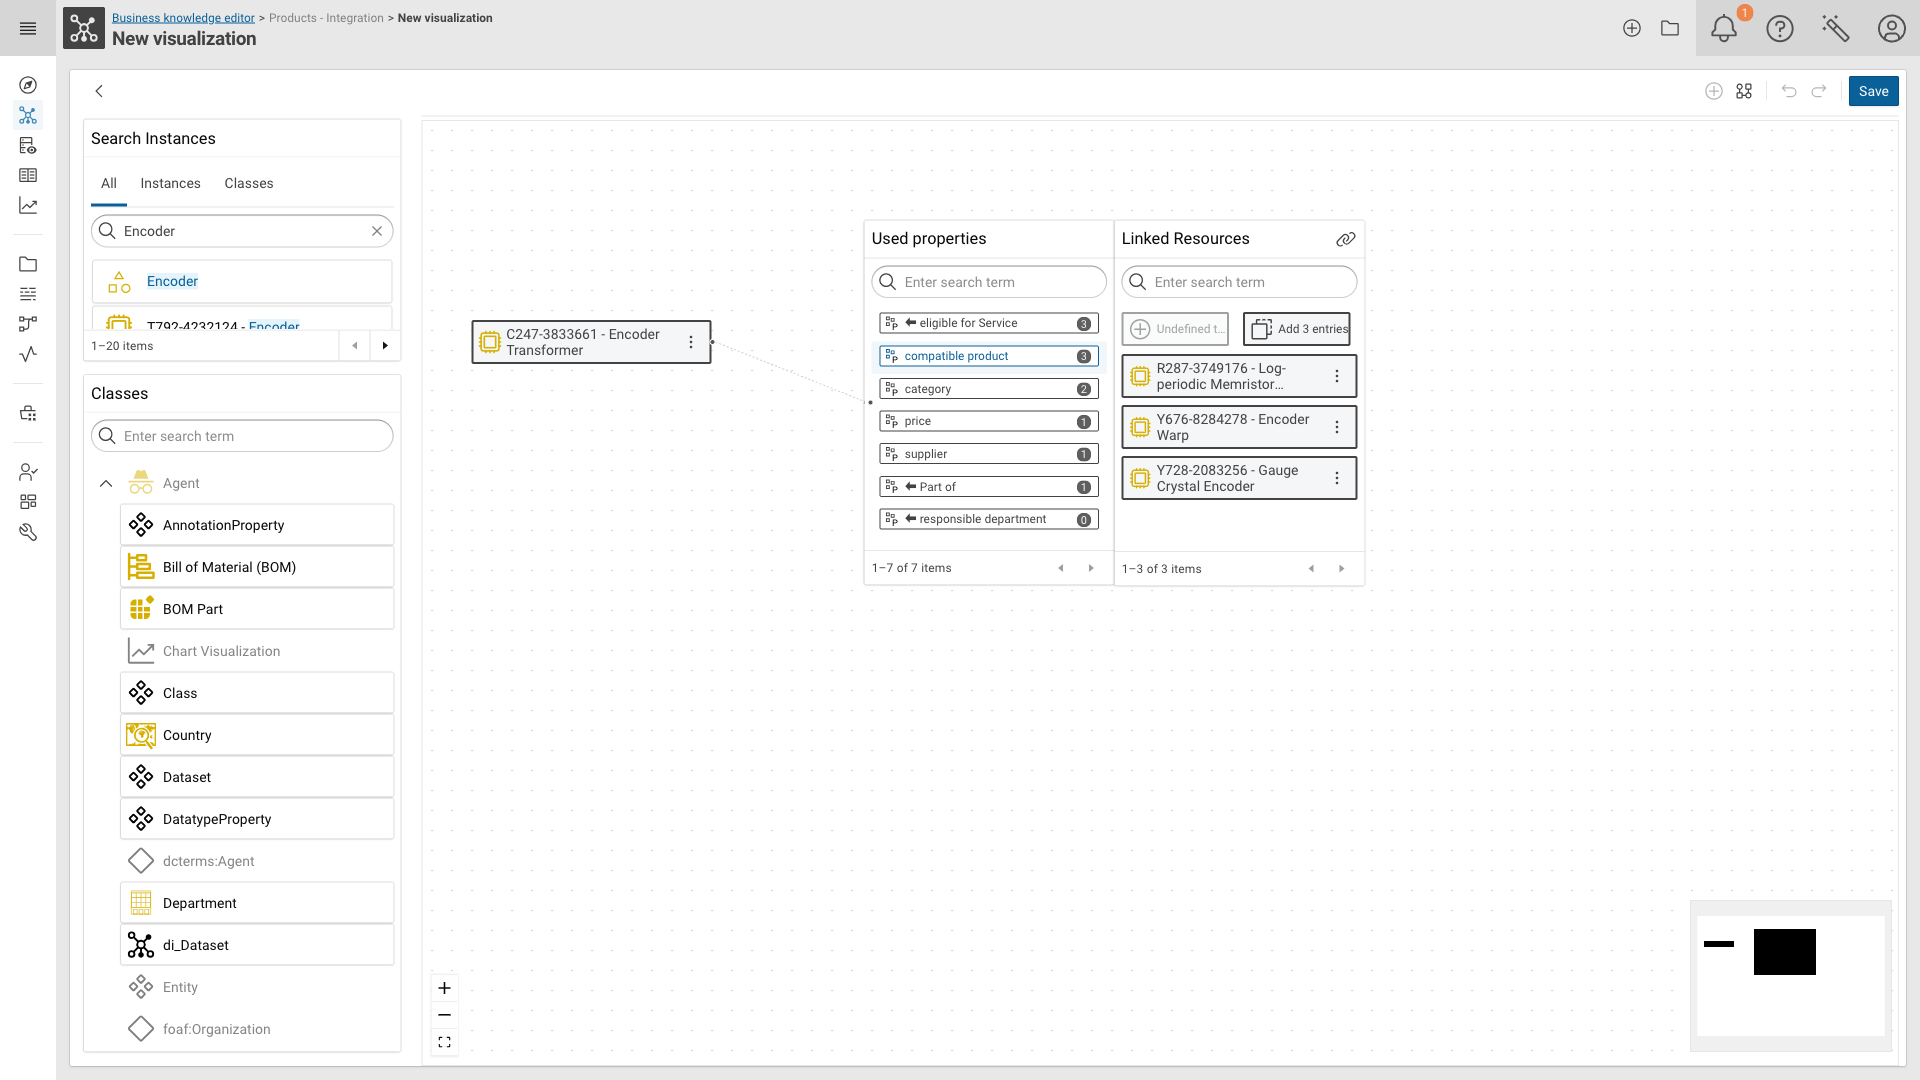
From here you can:
- click a single resource to add it to the canvas,
- drag
Add N entriesonto the canvas to add all listed resources at once, - drag
New <Class>onto the canvas to create a new resource of the property’s target class and link it directly. If the property has no target class or shape defined, this button is disabled and labeledUndefined target class or shape.
Repeat the expansion on any node to grow the visualization. Use Arrange in the canvas toolbar to re-layout the result.
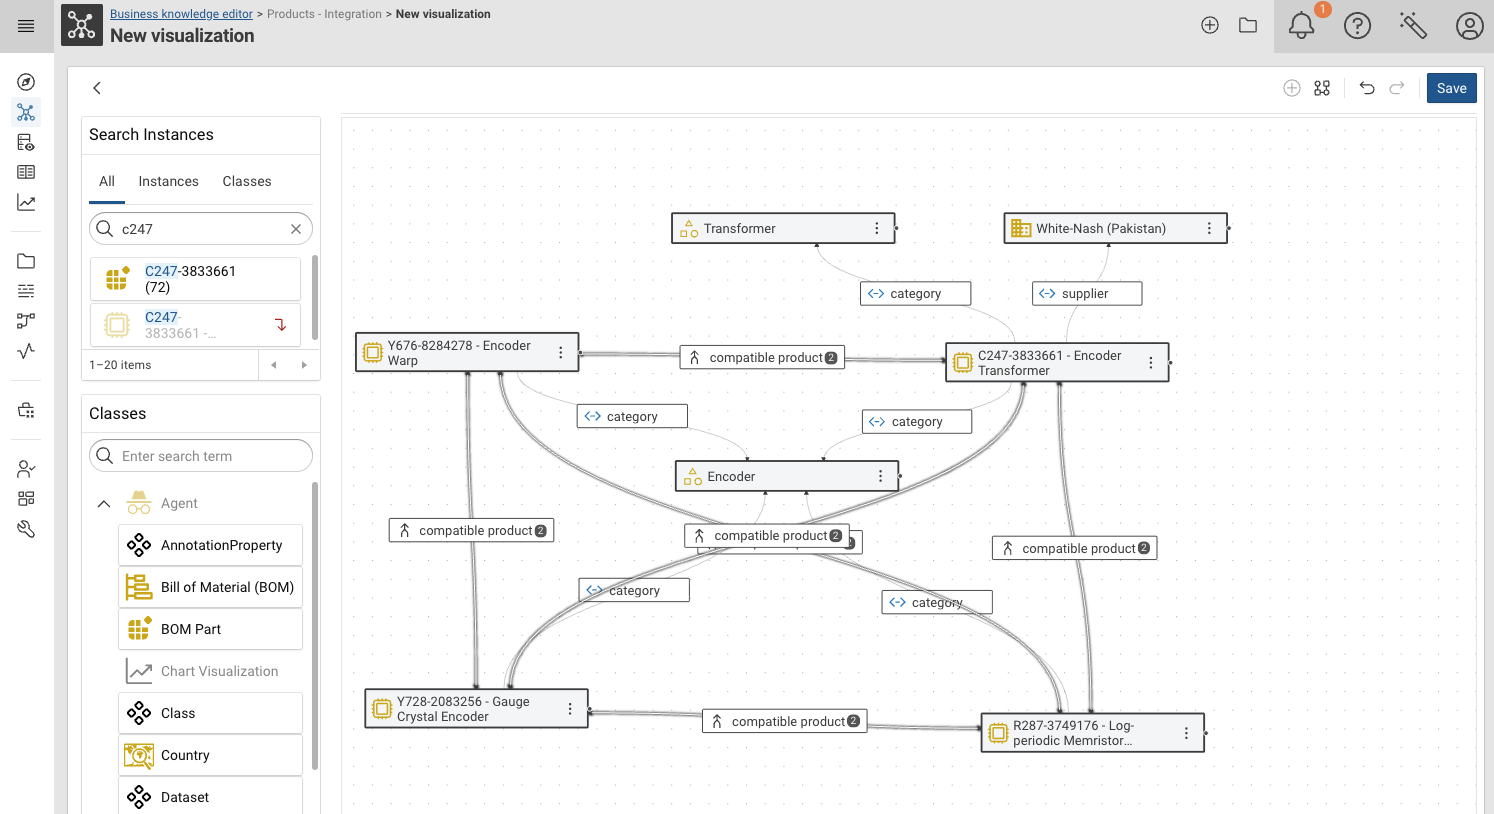
Inspecting and editing a resource¤
Double-click a node to open the details panel on the right side. It shows the literal values of the resource and highlights its relations on the canvas.
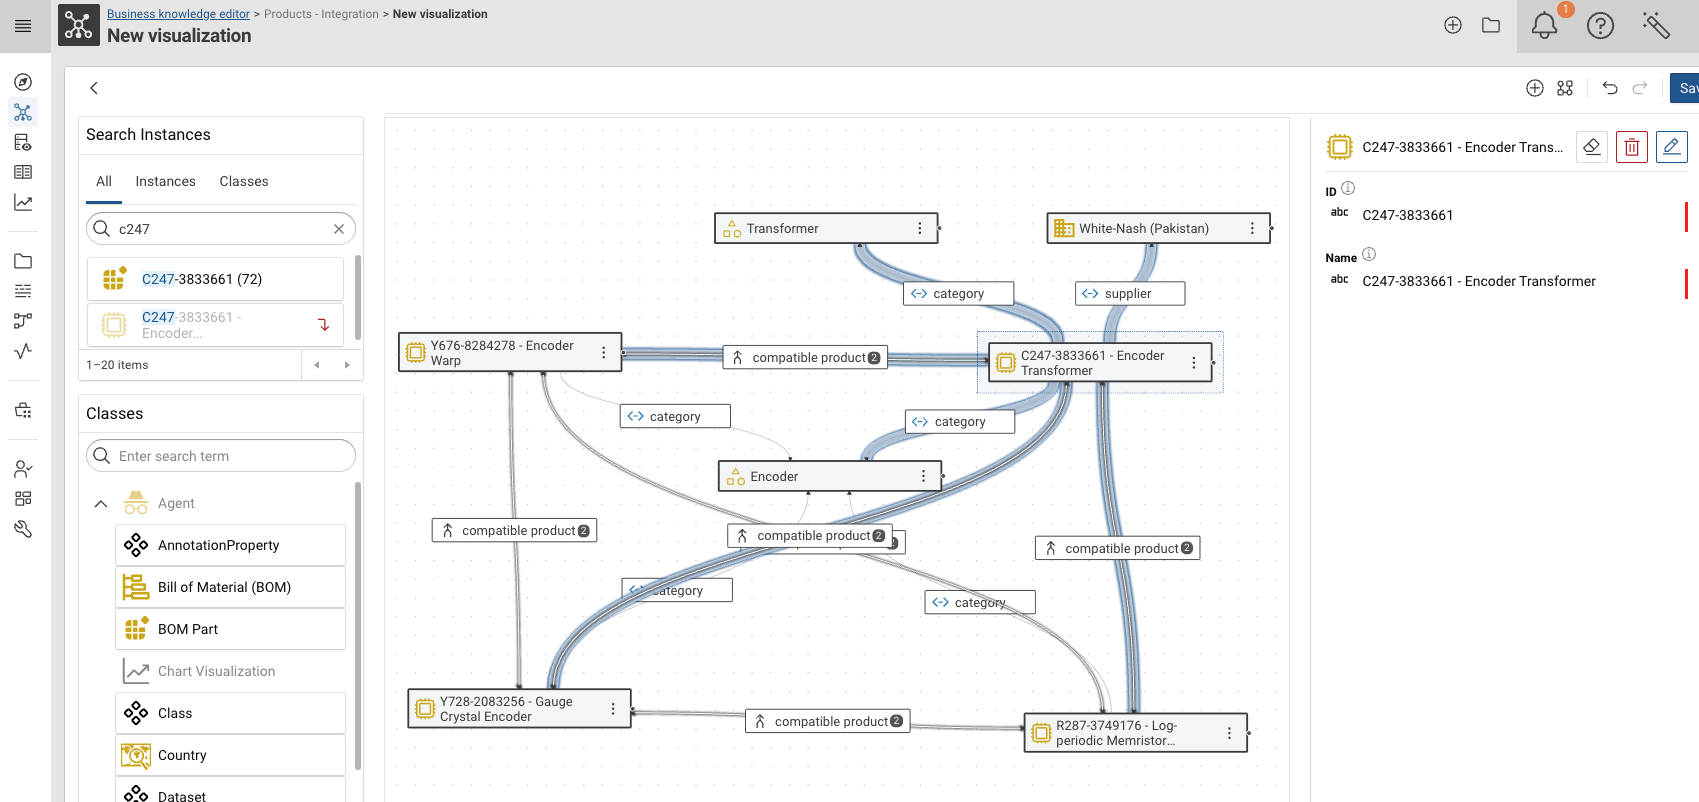
The buttons in the panel header are:
| Button | Description |
|---|---|
| Remove from visualization | Removes the node from the canvas, the resource stays in the graph. |
| Remove from graph | Marks the resource for deletion from the graph. |
| Edit mode | Switches the panel into a form to change the resource’s values. |
The menu of a node offers View in Knowledge Graph, New query using this resource and Copy resource identifier.
Saving¤
Click Save in the canvas toolbar.
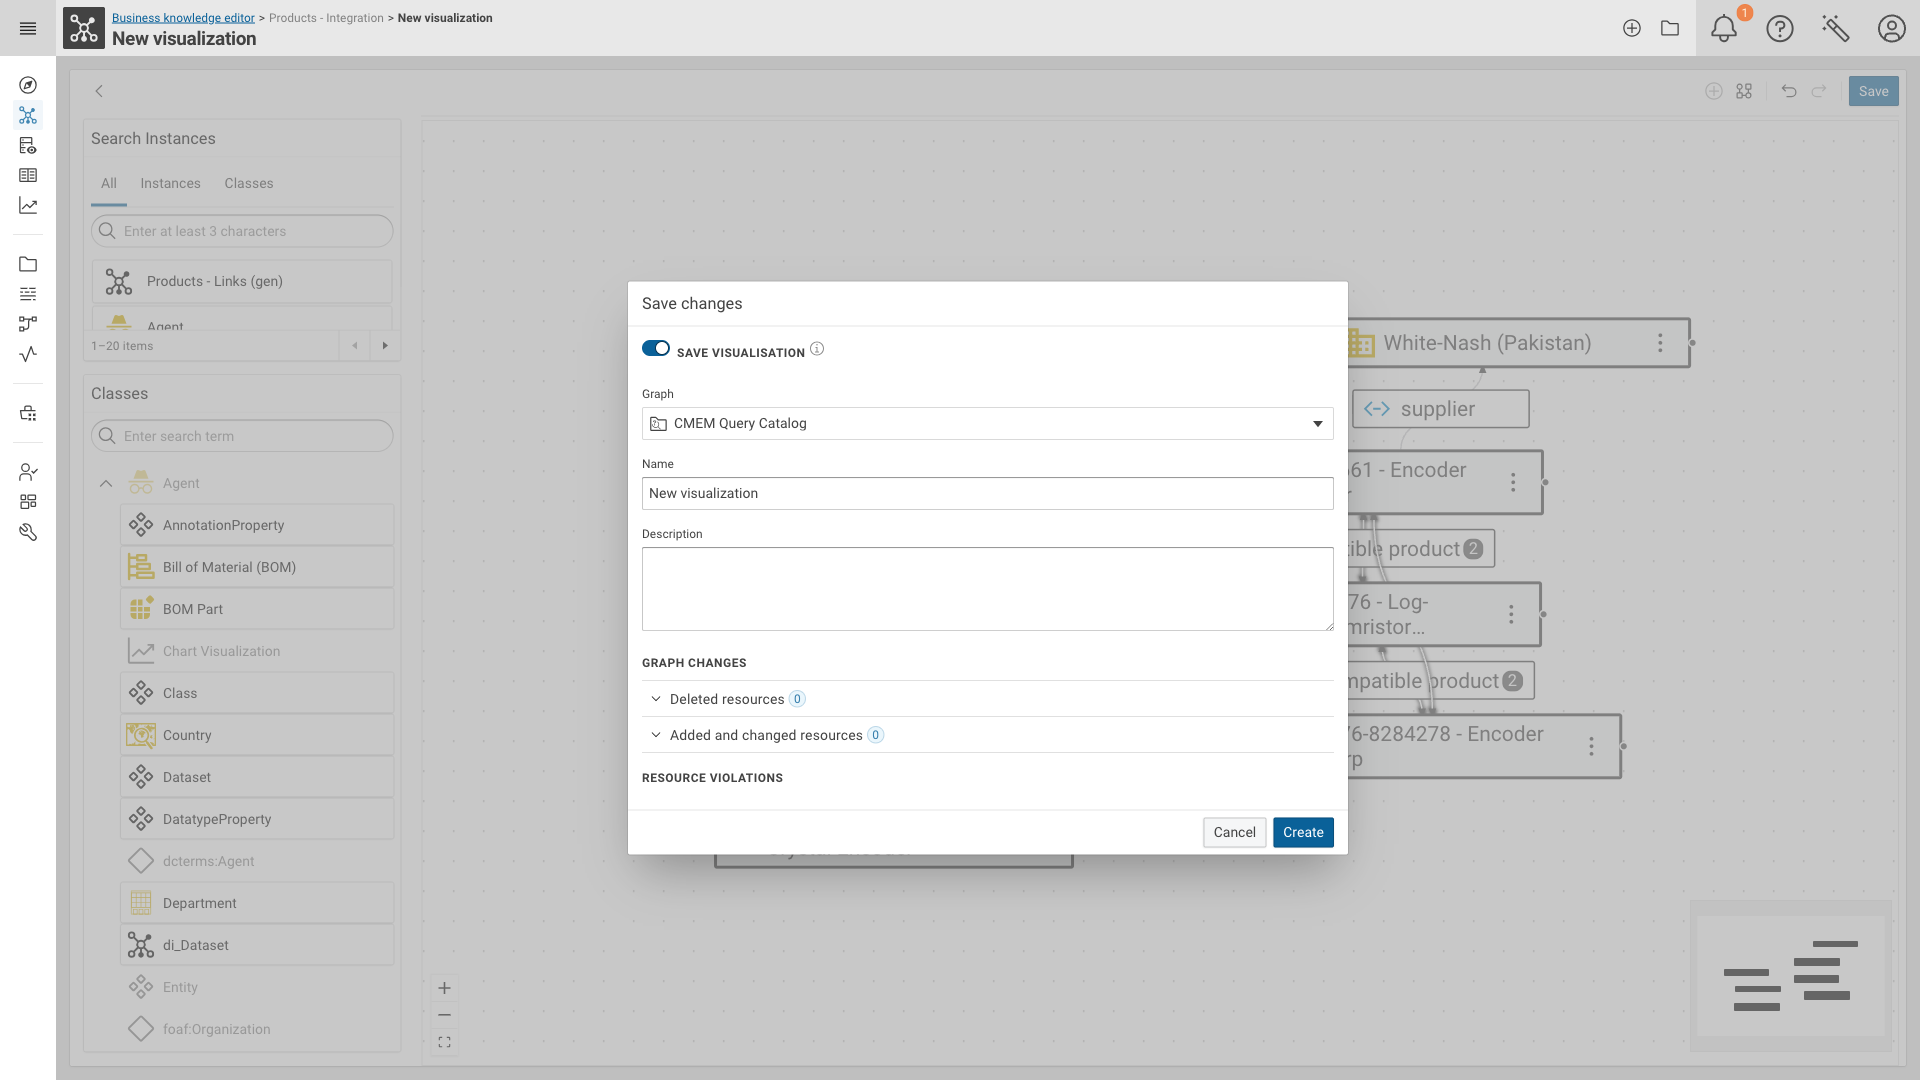
The dialog covers both aspects of a BKE session:
- SAVE VISUALISATION — stores the canvas itself as a named visualization.
Select the Graph it is stored in (
CMEM Query Catalogby default) and provide Name and Description. Switch the toggle off to only write the graph changes without storing a visualization. - GRAPH CHANGES — lists the resources you deleted, added or changed during the session, together with the RESOURCE VIOLATIONS reported for them.
Re-opening a saved visualization¤
Click Load existing visualization in the application header to open the Visualization catalog.
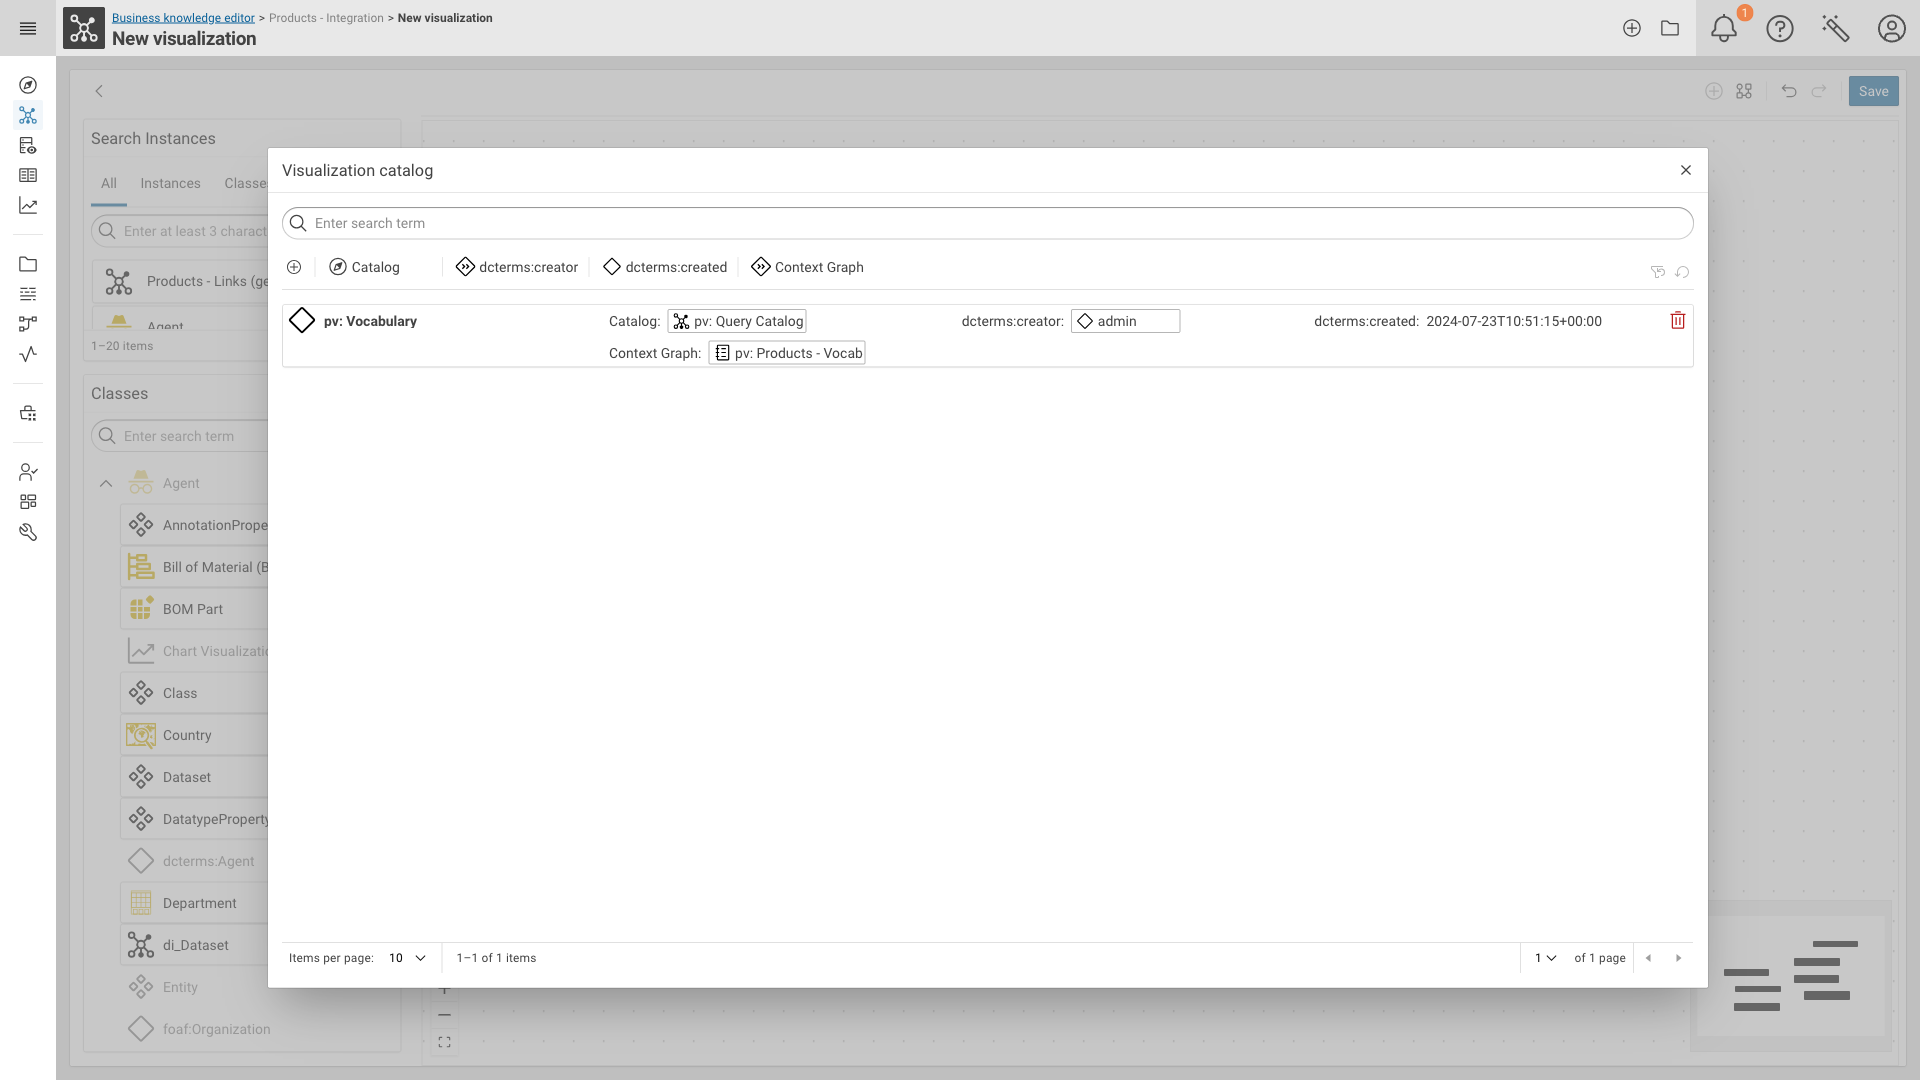
The catalog is a faceted list of all saved visualizations. Click an entry to open it, or use to delete it.
Configuration¤
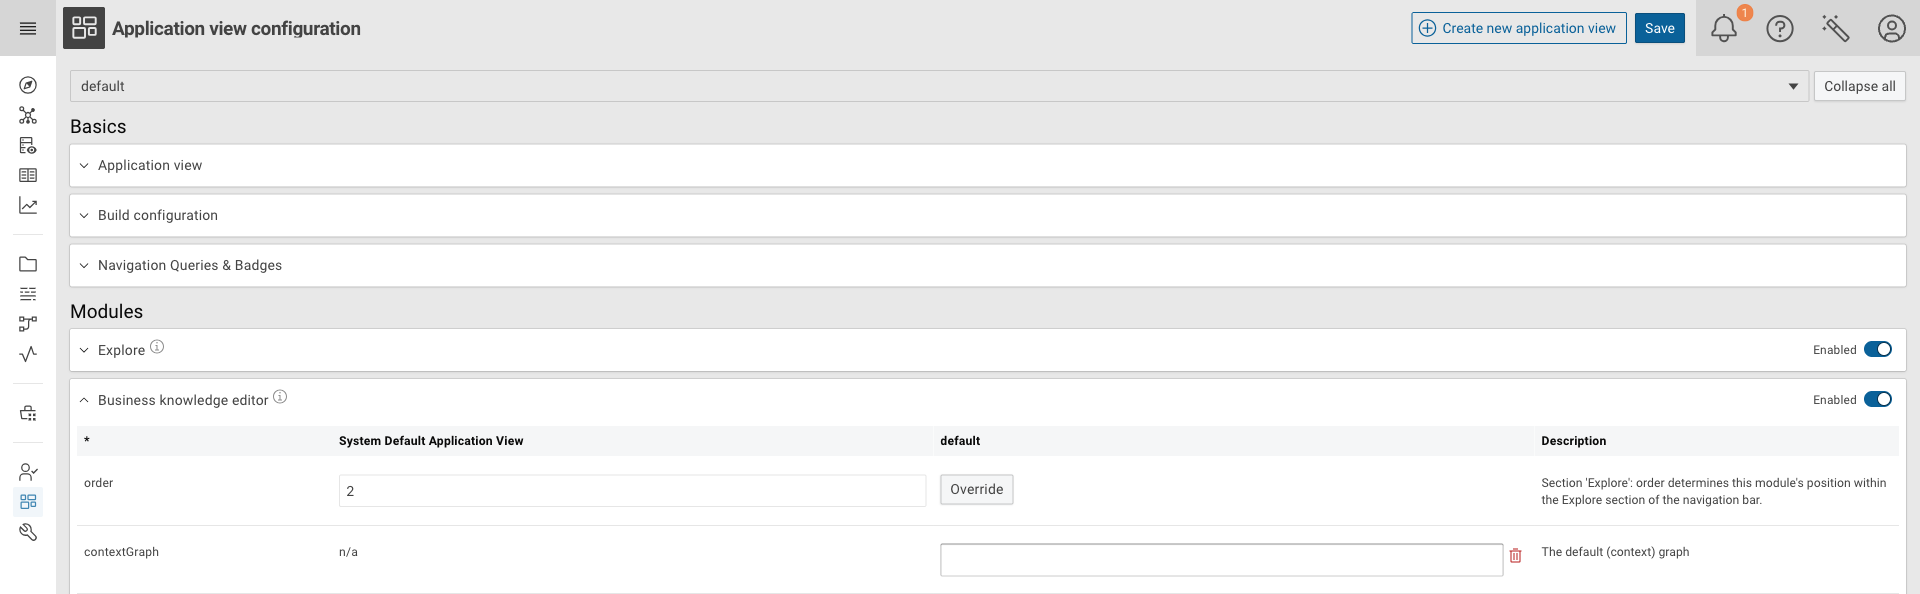
The module is enabled by default. All of its settings are part of the Application view configuration module, in the Business knowledge editor section of the Modules list.
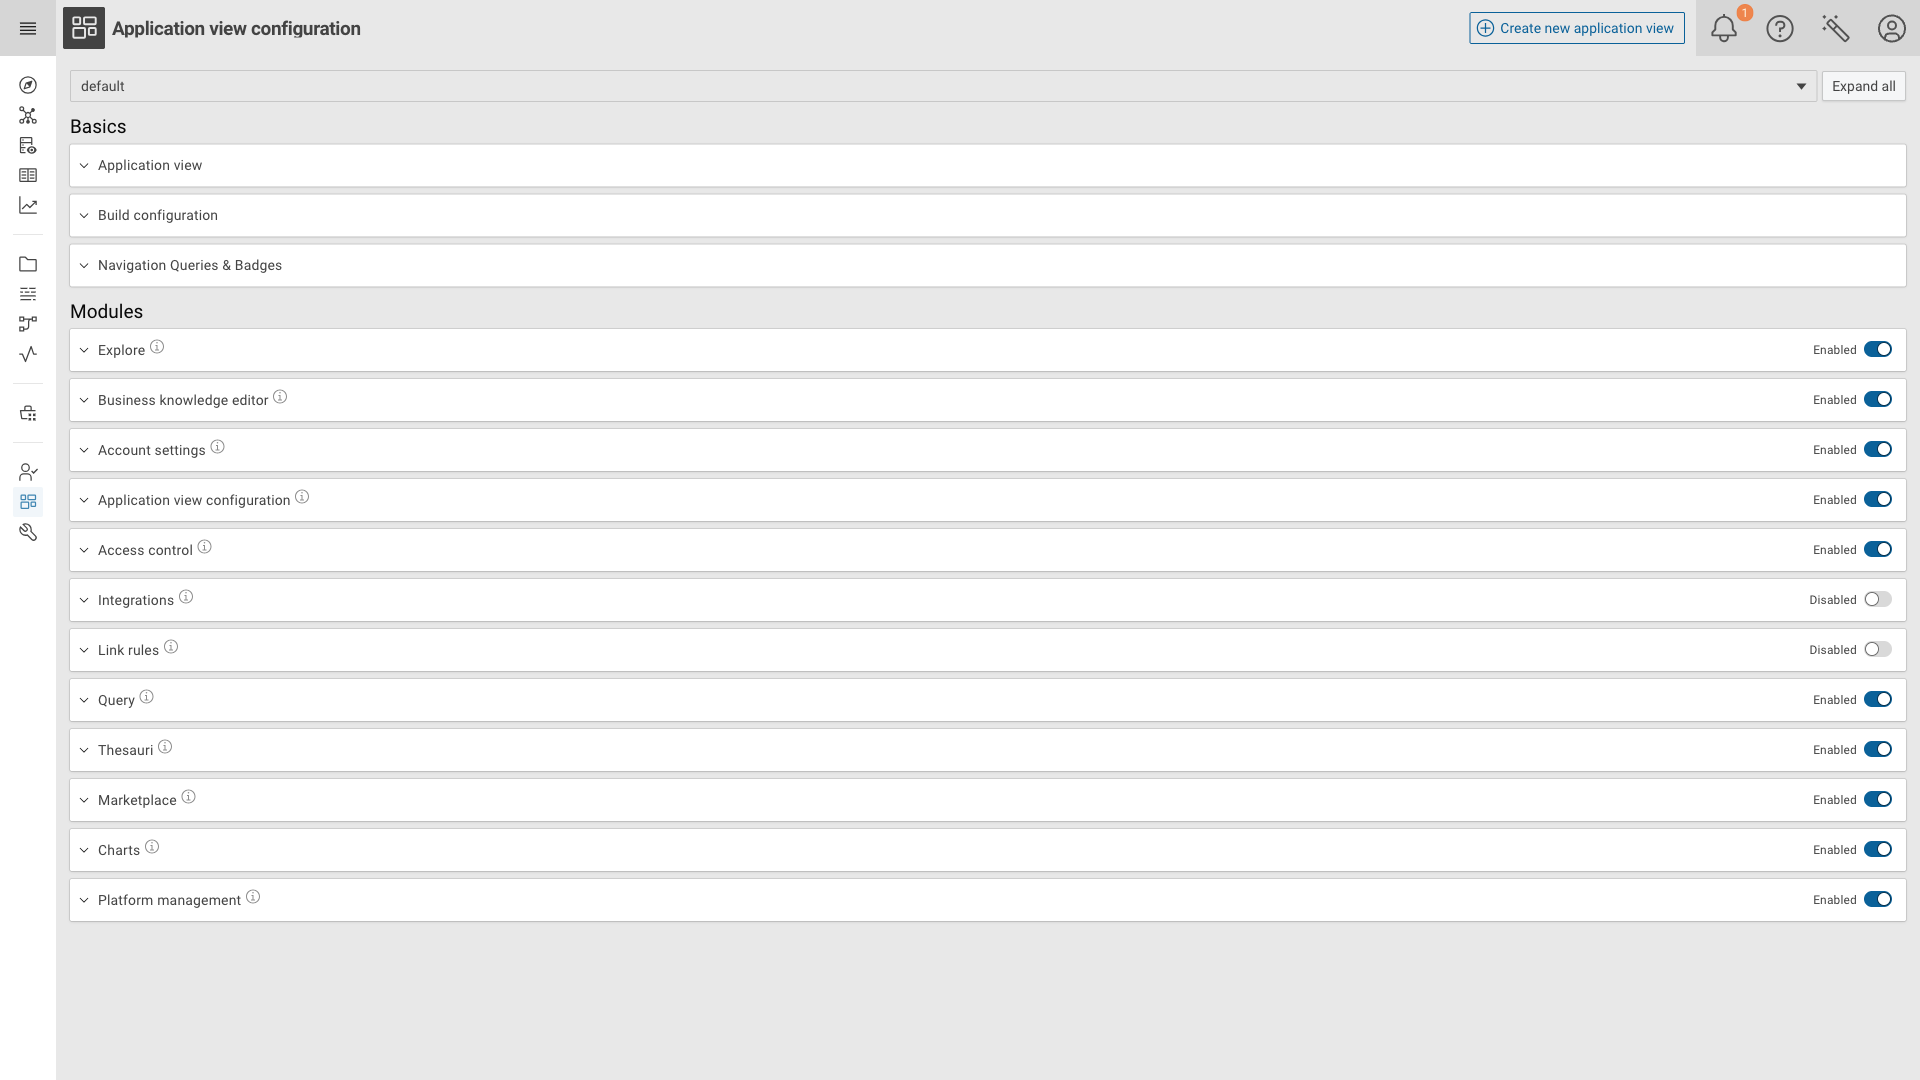
Expand the section to see the parameters.
The System Default Application View column shows the platform-wide default, the column named after the current
Application view (default in the screenshot) holds the value used by that Application view.
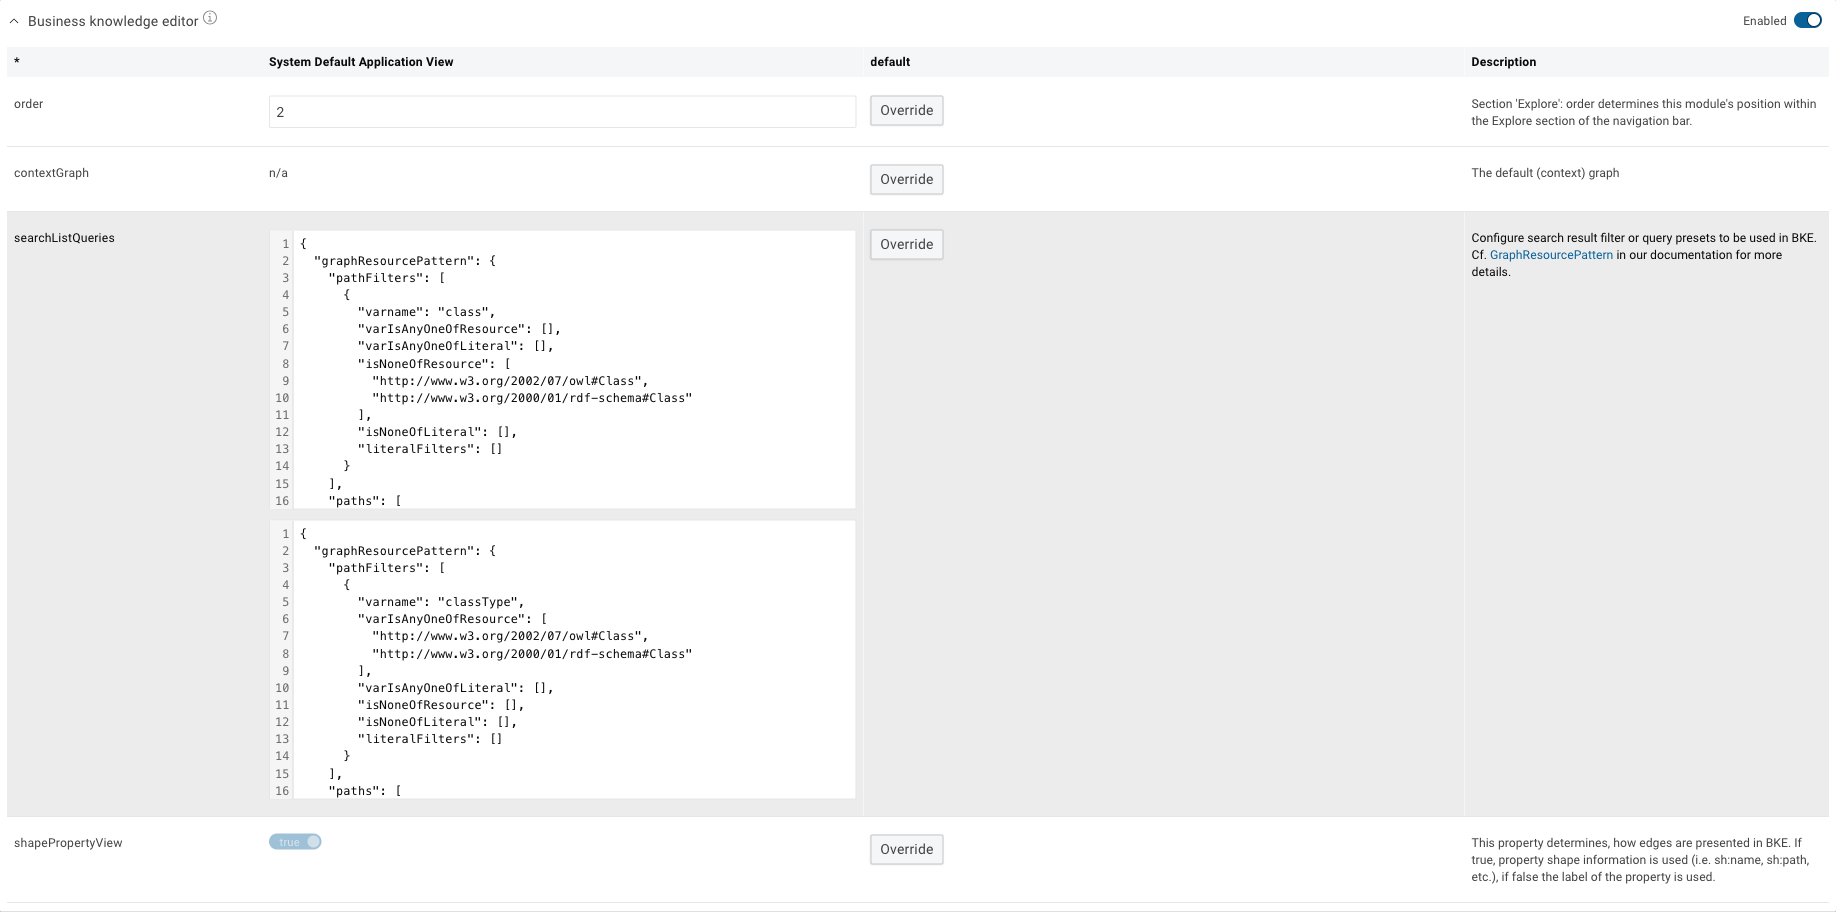
Parameters¤
| Parameter | Description |
|---|---|
order |
Position of the module within the Explore section of the navigation bar. |
contextGraph |
The graph explored by default. If set, the graph drop-down on the welcome screen is not shown. |
searchListQueries |
Search result filter / query presets used by the module. Each entry is a GraphResourcePattern together with a label; the label becomes a tab in the Search Instances panel. Defaults to one preset for Instances (everything that is not a class) and one for Classes. |
shapePropertyView |
Determines how edges are presented. If true, property shape information is used (sh:name, sh:path, …), if false the label of the property is used. |
Overriding a parameter for an Application view¤
Click Override next to a parameter to set an Application view specific value. The value becomes editable and a appears to drop the override again and fall back to the system default. Confirm your changes with Save in the application header.
Note
Toggling the module itself off in the section header removes Business knowledge editor from the navigation of that Application view.